
Recession Impact and Recovery Scores help banks and lenders improve portfolio risk analysis
Published 14th Sep 2020 Predictive AnalyticsRiskThe current economic downturn follows what is, perhaps, one of the countryâs longest economic expansions.Â
But the expansion was not uniform in all parts of the country. In past analyses, we showed that the Great Recession of 2008 had significant impacts on rural economies. Among those changes: a shift in many regions away from heavy blue collar jobs and toward service occupations.Â
And now, three new recession impact models from Powerlytics show that some areas of the country may be less able to withstand economic shocks, and are more likely to suffer long-term consequences as a result of downturns.Â
The Powerlytics Recession Impact, Short-Term Recession, and Long-Term Recession scores are tools to help banks and other financial services providers understand which customers and which areas within a business will be impacted by a recession. We recently put all three models to the test with a client data set of credit cards, auto financing, and other unsecured consumer loans.
In our model, a high score (90-100) indicates that an area has been hard hit by a recession. What we found for all models was an extremely high correlation between geographic areas that had high recession scores and high loan default rates in the two years leading up to the 2020 downturn. For the Recession Impact and Short-Term Recession Recovery scores we found the 10% of ZIP Codes that were most severely impacted by the 2008 recession had a charge-off rate 2,600% higher than the 10% of areas that ranked among the least severely impacted.Â

Fig. 1 The Recession Impact scores for borrowers in the 10% of ZIP Codes that were most severely impacted by the 2008 recession had a charge-off rate 2,600 times higher than the 10% of areas that ranked among the least severely impacted (48.75% vs. 1.76%).Â
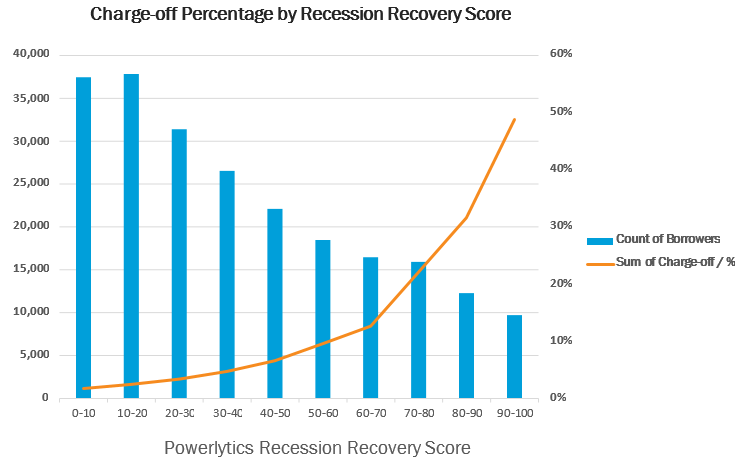
Fig. 2 The Short-Term Recession Recovery scores in the areas that fell in the top 10% of the most severely impacted had a charge-off rate 2,600% higher than the 10% of areas that ranked among the least severely impacted (48.8% vs. 1.78%).
When it came to Long-Term Recession Recovery scores, the 10% of areas ranked as most severely impacted areas had a charge-off rate more 1,600% higher than the least severely impacted areas.
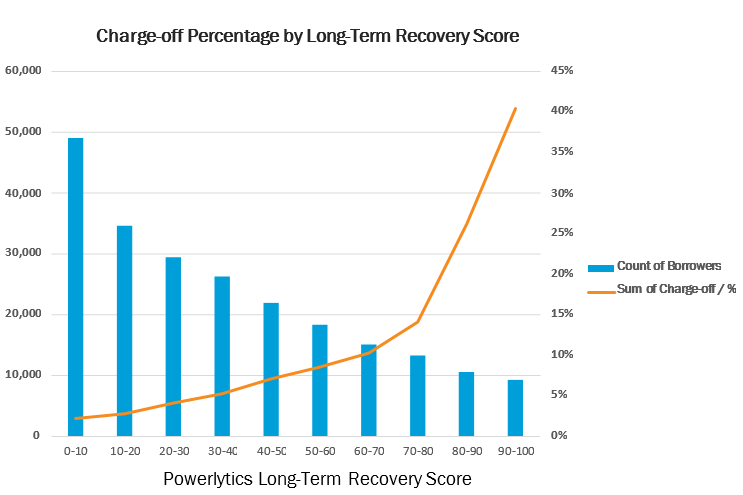
Fig. 3 The Long-Term Recession Recovery scores in the areas that fell in the top 10% of the most severely impacted had a charge-off rate 1,600% higher than the 10% of areas that ranked among the least severely impacted (40.47% vs. 2.28%).Â
While troubled loans in areas where the effects of the recession were particularly bad made up just a small fraction of the lenderâs portfolio, the defaults in that area had an outsize effect. Areas hit hard by the 2008 pandemic continued to see high rates of default 10 years later, proving that the effects of a recession seem to be fairly long lasting for some geographies.Â
These tools, and the insight they bring, can inform the way lenders devote resources at the whiff of a downturn. Whether they are used to accelerate loan approvals in areas that are capable of withstanding downturns, or offer assistance to those most in need, these Recession Impact scores can be used within lenders portfolios to more accurately estimate reserves for charge-offs to account for any additional risk brought on by a down economy.
To find out how Powerlyticsâ Recession Impact and Recession Recovery score can help you, email us at sales@powerlytics.com.
Read next

Published 15th May 2020
RiskWhat data from the Great Recession can tell us about the Coronavirus Recession
According to a U.S. Chamber of Commerce survey in early April, nearly one out of every four small businesses closed their doors temporarily because of the coronavirus pandemic. A sizeable chunk of...
Read Article